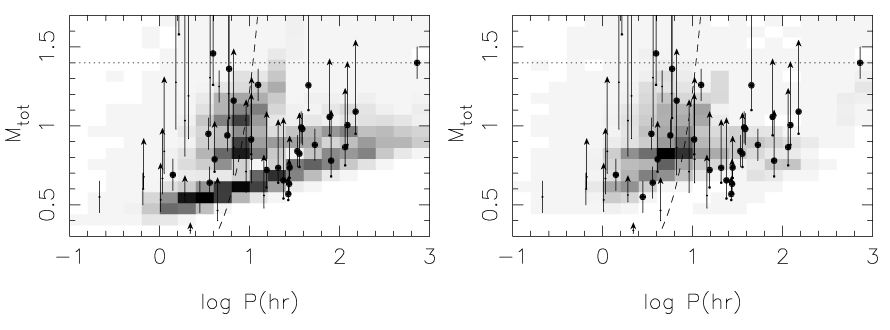
Figure 12: The total masses of binaries in the simulated population of WD binaries with  as a function of system’s orbital period. In the left plot the outcome of the first common envelope
stage is described by
as a function of system’s orbital period. In the left plot the outcome of the first common envelope
stage is described by  -formalism, Eq. (59*), and in the right plot – by
  -formalism, Eq. (57*). In
both plots the latter equation describes both common envelope stages. The grey scale (the same for
both plots) corresponds to the density of objects in the linear scale. Observed WD binaries are shown
as filled circles (see the original paper for references). The Chandrasekhar mass limit is shown by
the dotted line. To the left of the dashed line the systems merge within 13.5 Gyr. Image reproduced
with permission from [766], copyright by ESO.
-formalism, Eq. (57*). In
both plots the latter equation describes both common envelope stages. The grey scale (the same for
both plots) corresponds to the density of objects in the linear scale. Observed WD binaries are shown
as filled circles (see the original paper for references). The Chandrasekhar mass limit is shown by
the dotted line. To the left of the dashed line the systems merge within 13.5 Gyr. Image reproduced
with permission from [766], copyright by ESO.
as a function of system’s orbital period. In the left plot the outcome of the first common envelope
stage is described by -formalism, Eq. (59*), and in the right plot – by -formalism, Eq. (57*). In
both plots the latter equation describes both common envelope stages. The grey scale (the same for
both plots) corresponds to the density of objects in the linear scale. Observed WD binaries are shown
as filled circles (see the original paper for references). The Chandrasekhar mass limit is shown by
the dotted line. To the left of the dashed line the systems merge within 13.5 Gyr. Image reproduced
with permission from [766], copyright by ESO.Konstantin A. Postnov and Lev R. Yungelson, "The Evolution of Compact Binary Star Systems",
Living Rev. Relativity, 17 (2014), 3, doi:10.12942/lrr-2014-3, URL (accessed <date>): http://www.livingreviews.org/lrr-2014-3. This work is licensed under a Creative Commons License.
© The author(s), except where otherwise noted.
This work is licensed under a Creative Commons License.
© The author(s), except where otherwise noted.
Living Rev. Relativity, 17 (2014), 3, doi:10.12942/lrr-2014-3, URL (accessed <date>): http://www.livingreviews.org/lrr-2014-3.
This work is licensed under a Creative Commons License.
© The author(s), except where otherwise noted.