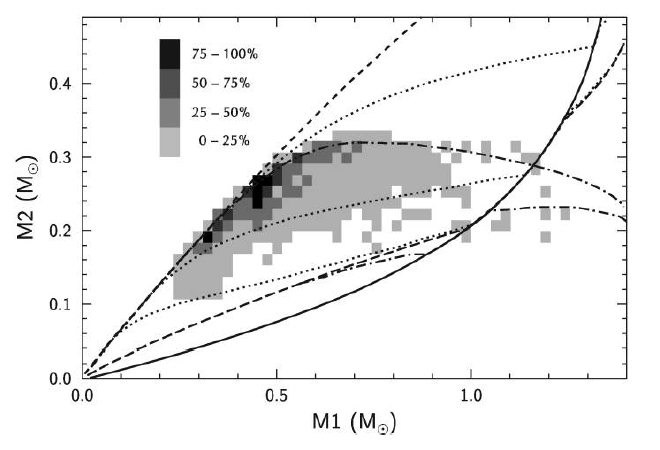
Figure 22: Birthrates and stability limits for mass transfer between close WD binaries. The shaded
areas show the birth probability of progenitors of AM CVn stars in double-degenerate channel scaled
to the maximum birth rate per bin of  [518]. The upper dashed line corresponds to
the upper limit for stable mass transfer. The lower solid line is the lower limit for direct accretion.
The upper dash-dot line is the limit set by the Eddington luminosity for stable mass transfer at
a synchronization time limit
[518]. The upper dashed line corresponds to
the upper limit for stable mass transfer. The lower solid line is the lower limit for direct accretion.
The upper dash-dot line is the limit set by the Eddington luminosity for stable mass transfer at
a synchronization time limit  . The lower dash-dot line is the limit set by the Eddington
luminosity for
. The lower dash-dot line is the limit set by the Eddington
luminosity for  , and the lower broken line is the strict stability limit for the same. The
three dotted lines show how the strict stability limit is raised for shorter synchronization time-scales
ranging from 1000 yr (bottom), 10 yr (center), and 0.1 yr (top). Image reproduced with permission
from Figure 3 of [725], copyright by ASP.
, and the lower broken line is the strict stability limit for the same. The
three dotted lines show how the strict stability limit is raised for shorter synchronization time-scales
ranging from 1000 yr (bottom), 10 yr (center), and 0.1 yr (top). Image reproduced with permission
from Figure 3 of [725], copyright by ASP.
[518]. The upper dashed line corresponds to
the upper limit for stable mass transfer. The lower solid line is the lower limit for direct accretion.
The upper dash-dot line is the limit set by the Eddington luminosity for stable mass transfer at
a synchronization time limit . The lower dash-dot line is the limit set by the Eddington
luminosity for , and the lower broken line is the strict stability limit for the same. The
three dotted lines show how the strict stability limit is raised for shorter synchronization time-scales
ranging from 1000 yr (bottom), 10 yr (center), and 0.1 yr (top). Image reproduced with permission
from Figure 3 of [725], copyright by ASP.Konstantin A. Postnov and Lev R. Yungelson, "The Evolution of Compact Binary Star Systems",
Living Rev. Relativity, 17 (2014), 3, doi:10.12942/lrr-2014-3, URL (accessed <date>): http://www.livingreviews.org/lrr-2014-3. This work is licensed under a Creative Commons License.
© The author(s), except where otherwise noted.
This work is licensed under a Creative Commons License.
© The author(s), except where otherwise noted.
Living Rev. Relativity, 17 (2014), 3, doi:10.12942/lrr-2014-3, URL (accessed <date>): http://www.livingreviews.org/lrr-2014-3.
This work is licensed under a Creative Commons License.
© The author(s), except where otherwise noted.