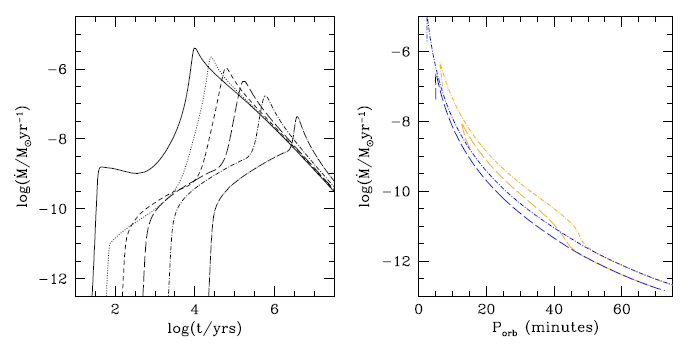
Figure 24: Left panel: the  evolution of AM CVn systems with
  and
and
 . Systems with donors having the degeneracy parameter
  = 3.5, 3.0,
2.5, 2.0, 1.5 and 1.1 are shown by the solid, dotted, short-dashed, dashed, shortdash-dotted and
dash-dotted lines, respectively. Right panel: the dependence of the
= 3.5, 3.0,
2.5, 2.0, 1.5 and 1.1 are shown by the solid, dotted, short-dashed, dashed, shortdash-dotted and
dash-dotted lines, respectively. Right panel: the dependence of the  relation on the initial
binary parameters for pairs
relation on the initial
binary parameters for pairs  ,
,  (yellow dashed line),
 ,
,
 (yellow dot-dashed line),
  ,
,  (blue
dashed line),
(blue
dashed line),  ,
,  (blue dot-dashed line). Image
reproduced with permission from Figures 6 and 10 of [142], copyright by the authors.
(blue dot-dashed line). Image
reproduced with permission from Figures 6 and 10 of [142], copyright by the authors.
evolution of AM CVn systems with and
. Systems with donors having the degeneracy parameter = 3.5, 3.0,
2.5, 2.0, 1.5 and 1.1 are shown by the solid, dotted, short-dashed, dashed, shortdash-dotted and
dash-dotted lines, respectively. Right panel: the dependence of the relation on the initial
binary parameters for pairs , (yellow dashed line),
,
(yellow dot-dashed line), , (blue
dashed line), , (blue dot-dashed line). Image
reproduced with permission from Figures 6 and 10 of [142], copyright by the authors.Konstantin A. Postnov and Lev R. Yungelson, "The Evolution of Compact Binary Star Systems",
Living Rev. Relativity, 17 (2014), 3, doi:10.12942/lrr-2014-3, URL (accessed <date>): http://www.livingreviews.org/lrr-2014-3. This work is licensed under a Creative Commons License.
© The author(s), except where otherwise noted.
This work is licensed under a Creative Commons License.
© The author(s), except where otherwise noted.
Living Rev. Relativity, 17 (2014), 3, doi:10.12942/lrr-2014-3, URL (accessed <date>): http://www.livingreviews.org/lrr-2014-3.
This work is licensed under a Creative Commons License.
© The author(s), except where otherwise noted.