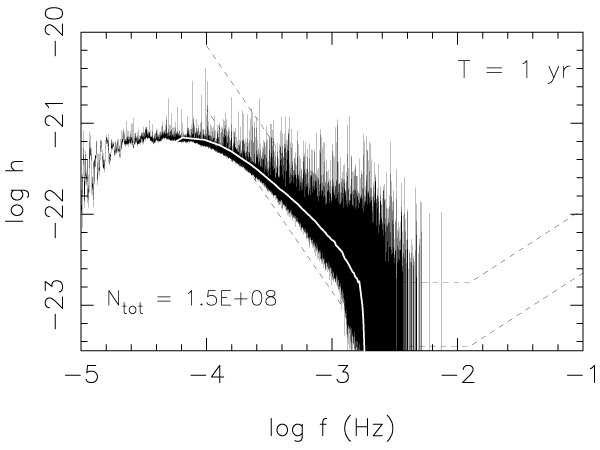
Figure 32: GWR foreground produced by detached and semidetached WD binaries as it was expected
to be detected by LISA. The assumed integration time is 1 yr. The ‘noisy’ black line gives the
total power spectrum, the white line shows the average. The dashed lines show the expected LISA
sensitivity for a  of 1 and 5 [408]. Semidetached WD binaries contribute to the peak between
 and
and  . Image reproduced with permission from [518], copyright by ESO.
of 1 and 5 [408]. Semidetached WD binaries contribute to the peak between
and . Image reproduced with permission from [518], copyright by ESO.Konstantin A. Postnov and Lev R. Yungelson, "The Evolution of Compact Binary Star Systems",
Living Rev. Relativity, 17 (2014), 3, doi:10.12942/lrr-2014-3, URL (accessed <date>): http://www.livingreviews.org/lrr-2014-3. This work is licensed under a Creative Commons License.
© The author(s), except where otherwise noted.
This work is licensed under a Creative Commons License.
© The author(s), except where otherwise noted.
Living Rev. Relativity, 17 (2014), 3, doi:10.12942/lrr-2014-3, URL (accessed <date>): http://www.livingreviews.org/lrr-2014-3.
This work is licensed under a Creative Commons License.
© The author(s), except where otherwise noted.