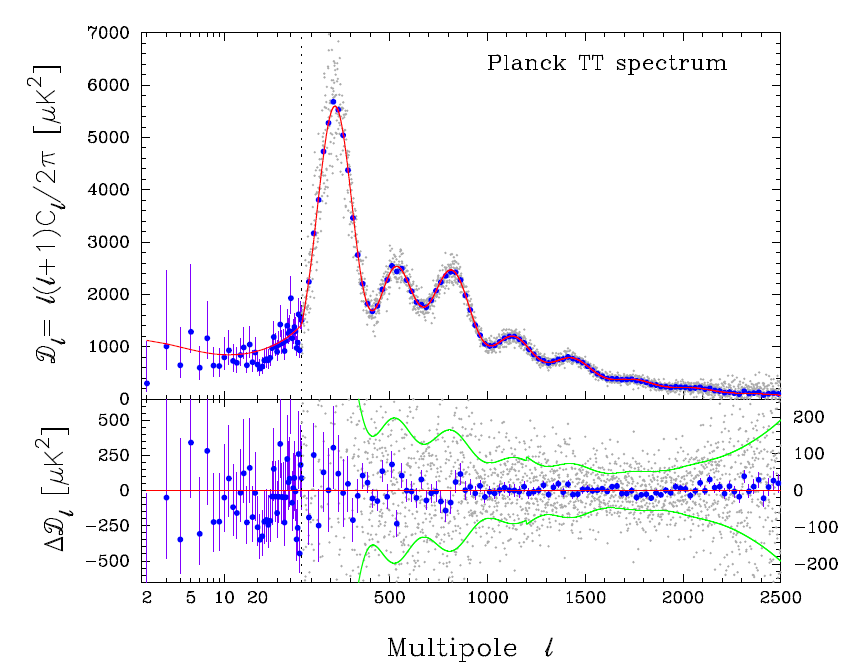
Figure 8: Diagram of the CMB anisotropies, plotted as strength against spatial frequency, from the
2013 Planck data. The measured points are shown together with best-fit models. Note the acoustic
peaks, the largest of which corresponds to an angular scale of about half a degree. Image reproduced
with permission from [2], copyright by ESO.