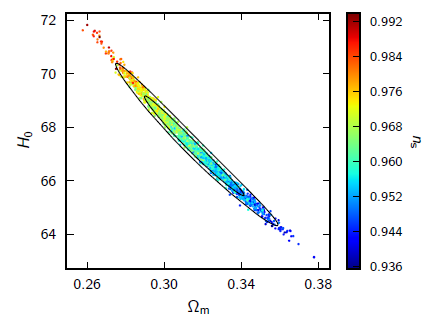
Figure 9: The allowed range of the parameters  ,
,  , from the 2013 Planck data, is shown as
a series of points. A flat Universe is assumed, together with information from the Planck fluctuation
temperature spectrum, CMB lensing information from Planck, and WMAP polarization observations.
The colour coding reflects different values of
, from the 2013 Planck data, is shown as
a series of points. A flat Universe is assumed, together with information from the Planck fluctuation
temperature spectrum, CMB lensing information from Planck, and WMAP polarization observations.
The colour coding reflects different values of  , the spectral index of scalar perturbations as a
function of spatial scale at early times. Image reproduced with permission from [2], copyright by
ESO.
, the spectral index of scalar perturbations as a
function of spatial scale at early times. Image reproduced with permission from [2], copyright by
ESO.
, , from the 2013 Planck data, is shown as
a series of points. A flat Universe is assumed, together with information from the Planck fluctuation
temperature spectrum, CMB lensing information from Planck, and WMAP polarization observations.
The colour coding reflects different values of , the spectral index of scalar perturbations as a
function of spatial scale at early times. Image reproduced with permission from [2], copyright by
ESO.