 -decoupling
limit of bi-gravity
-decoupling
limit of bi-gravity
 )
)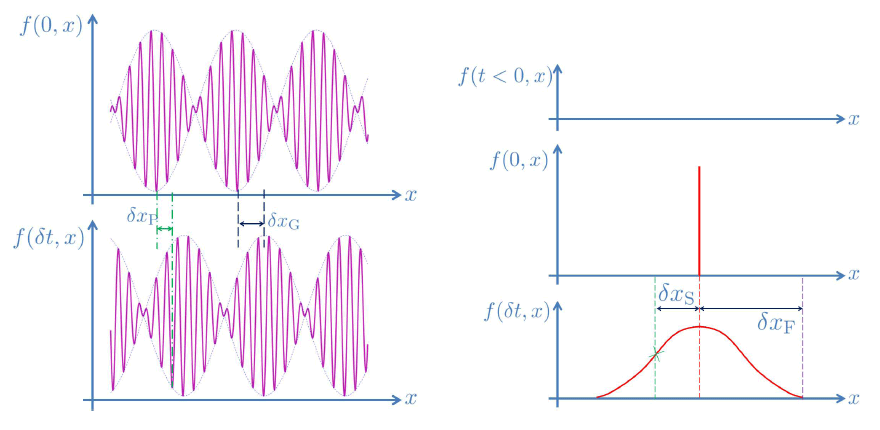
Figure 5: Difference between phase, group, signal and front velocities. At  , the phase
and group velocities are represented on the left and given respectively by
, the phase
and group velocities are represented on the left and given respectively by  and
and
 (in the limit
  .) The signal and front velocity represented on the right are
given by
.) The signal and front velocity represented on the right are
given by  (where
  is the point where at least half the intensity of the original
signal is reached.) The front velocity is given by
is the point where at least half the intensity of the original
signal is reached.) The front velocity is given by  .
.
, the phase
and group velocities are represented on the left and given respectively by and
(in the limit .) The signal and front velocity represented on the right are
given by (where is the point where at least half the intensity of the original
signal is reached.) The front velocity is given by .Claudia de Rham, "Massive Gravity",
Living Rev. Relativity, 17 (2014), 7, doi:10.12942/lrr-2014-7, URL (accessed <date>): http://www.livingreviews.org/lrr-2014-7. This work is licensed under a Creative Commons License.
© The author(s), except where otherwise noted.
This work is licensed under a Creative Commons License.
© The author(s), except where otherwise noted.
Living Rev. Relativity, 17 (2014), 7, doi:10.12942/lrr-2014-7, URL (accessed <date>): http://www.livingreviews.org/lrr-2014-7.
This work is licensed under a Creative Commons License.
© The author(s), except where otherwise noted.